What is Inflation?
If you are tuned in to financials news, you have likely read articles about rising inflation. Some articles warn of stock price declines. It is important to understand the meaning of inflation and the historical impact of high inflation.
So here we are, nearing the middle of 2021 and pandemic focused topics are fading. Something needs to replace the headlines but what will it be? For sure, it needs to grab the reader’s attention and what better way than to induce fear? After all, we know it works. Somebody somewhere started with inflation and it seems to have caught on.
Inflation can be measured multiple ways and thus, leads to various interpretations. One thing is clear, it impacts families differently. If you own a delivery business or travel for a living, rising fuel prices will have a greater impact. Same if you own a restaurant and food prices increase. The level of impact at the personal level is dependent on the goods and services we consume.
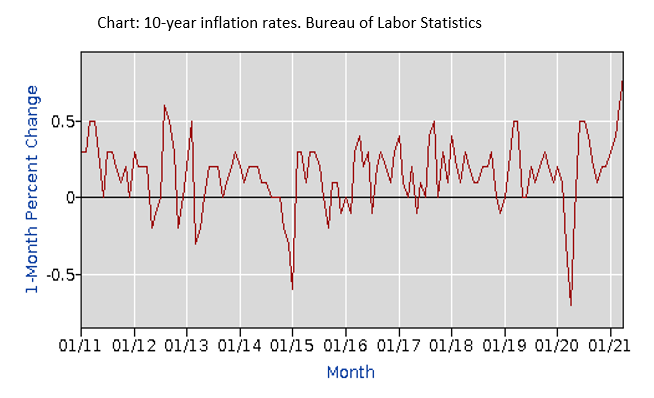
Two of the most common tracking methods are the Consumer Price Index (CPI) and the Wholesale Price Index (WPI). The CPI is a measure of the average change overtime in the prices paid by urban consumers for a market basket of consumer goods and services. The WPI is an index that measures and tracks the changes in the price of goods in the stages before the retail level. Simply stated, these two measurements attempt to quantify changes in price for goods and services of a cross section of consumers over selected time periods. What is the best method to measure inflation at an individual level? I would suggest neither of these. I believe your own shopping experience to be the best and most accurate tool.
Inflation occurs when the price paid for goods and services increase. Supply and demand play a major role in pricing. Over the past year, lumber prices have increased substantially. The demand for lumber outpaced the current supply and prices went up. External pressures are also a factor when companies raise and lower prices. When costs increase for a business, it can be expected for these costs to be passed along to the consumer. Absorbing the cost is detrimental to long term viability. History has shown inflation to be non-static. Change often brings concern but when it comes to the cost of goods and services it is to be expected.
Stock Prices and High Inflation
Why does it seem like every major event (real or perceived) should impact the stock market negatively? Maybe because we are bombarded by this notion by way of faulty information resources. If taxes are projected to increase, stock prices are expected to fall. If inflation goes up, headlines predict the stock market will go down. If leadership changes from one political party to another, we are warned to dump stocks. These are a few examples; I could go on and on, but you get my point. The history of stock prices provides a ton of evidence, none of which validates these expectations. What we can say about the history of broad market stock prices is that each past decline has been temporary, stock prices have shown tremendous resiliency following the toughest of economic times and new highs are normal.
Turning our attention back to inflation and letting history provide the lesson. In the past 50 years, the five highest inflation years occurred in 1980, 1979, 1974, 1981 and 1975 (in order of severity)1. A broad U.S. stock market index2 returned positive in three of the five years with an average return of 12.72%, which is higher than the 50-year average (1970-2020) of 10.80%3. The two decades with the highest inflation rates were the 1970’s and 1980’s (no surprise). The broad U.S. stock market index returned an average annualized return of 6.10% from 1970-1979 and 16.70% from 1980-1989. The annualized return from 1970-1989 was 11.30%.4 Personally, I do not see any evidence that would encourage the abandonment of a well-diversified, objective suited portfolio based on the expectation of rising inflation.
|
YEAR |
INFLATION (%) |
BROAD U.S STOCK MARKET INDEX RETURN (%) |
|
1980 |
13.58 |
32.80 |
|
1979 |
11.22 |
22.60 |
|
1974 |
11.02 |
(27.00) |
|
1981 |
10.35 |
(3.60) |
|
1975 |
9.20 |
38.80 |
|
AVERAGE |
11.07 |
12.72 |
Why You Should be Concerned About Inflation
The CPI rate from 2000-2020 averaged 2.10% (50% higher than the 2020 rate)5. Although less impactful than previous decades, the erosion of purchasing power is meaningful. A good example of purchasing power is what your dollar will buy in the future compared with today’s cost. Your automobile of choice may have cost $20,000 brand new in 2000 but if you wanted to purchase the same model today it would cost much more. Savings that earns little or no interest is likely diminishing in its future purchasing ability. As mentioned previously, an investment in the broad U.S. stock market index from 2000-2020 returned an average of 7.10%6, well above the inflation rate over the same time period and increasing a long-term investor’s purchasing power. I believe an investment in a broadly diversified stock portfolio has been shown historically to be a solid choice for offsetting inflation. I have said many times; we should not invest in stocks because we want to be risk takers, we own quality companies because we understand the need to outpace inflation on savings we do not plan on spending for a while. It just so happens this approach has been effective for longer than most of us have been living.
As long-term investors, there are a few expectations that must always be present. We should expect change, the status quo is temporary. Stock prices reflect current information and how the information is perceived by millions of market participants. On any given day, millions of investors are buying and selling. Buyers may reflect an optimistic attitude for the future and sellers could be feeling pessimistic. Two people can observe the same information and walk away with different views. This explains why market predictions are a waste of time. If history has taught us anything, it is that stock prices are unpredictable and volatile. In general, stock prices end the year negative about 25% of the time, or one out of four years. The average intra-year stock price decline is 14%7. Simply stated, we can expect a “bear market” decline every year and yet expect the market to end in positive territory three out of four years. The “x- factor” in stock returns is the uncertainty. Take away the uncertainty and you have also removed the potential for above average returns. If we acknowledge these things to the point of expectation, we will likely experience less negative emotion when they occur. In my experience, the two most traveled paths to investment failure are acting on emotions and having unrealistic expectations.
